Following a session
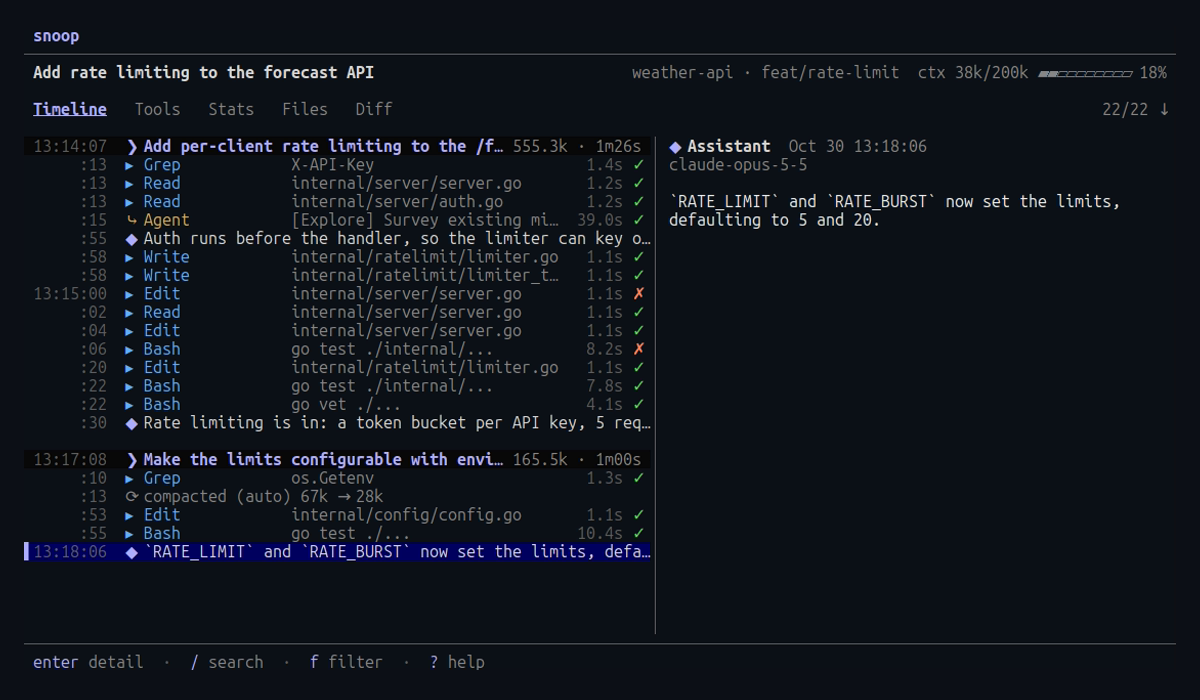
The timeline is where snoop starts when you open a session.
It lists every prompt, reply, thinking block and tool call, one per line, and keeps up as the session writes.
Each turn starts after a blank line, and a row in the same minute as the one above shows only its seconds (:42).
Follow live
snoop --followWith --follow, snoop opens the newest session for the current directory, or for --project DIR, and switches to a new one when Claude Code starts it.
While following, the newest event is selected as it arrives and the header shows ↓.
Moving up pauses following, and pressing G resumes it.
You can also open any session directly, by an id prefix or a path:
snoop 64f3ec44
snoop ~/.claude/projects/-home-me-src-api/64f3ec44-….jsonl
Read the timeline
Each tool row shows the call’s duration and status: ✓ done, ✗ error, ◌ running.
Each kind of tool has its own glyph and color:
| Glyph | Kind |
|---|---|
▸ | built-in tools such as Bash, Read and Edit |
✦ | skills |
⇄ | MCP calls, shown as server·tool |
⤷ | subagents |
Prompt rows show the turn’s tokens, estimated cost and duration.
A compaction appears as ⟳ compacted (auto) 253k → 68k.
The detail pane
The right pane shows the selected event in full: a Bash command and its output, an edit as a diff, the content of a Write, an agent’s prompt and result, a reply’s text.
Press enter or tab to focus it and scroll with ↑ ↓, or scroll it from the list with J K.
On narrow terminals the focused pane fills the screen.
Search and filter
Press / to search text, commands, paths and results; every word must match.
Press enter to keep the search or esc to clear it.
The f key cycles a filter through all, chat, tools, skills, MCP, agents and errors, and t shows thinking blocks, which are hidden by default.
Search and filters reach into subagents.
A collapsed Agent call whose subagent has matches stays in the list, marked ●.
The other tabs
| Tab | What it shows |
|---|---|
1 Timeline | every event, as above |
2 Tools | every call grouped by kind, then by name, with counts, errors and average latency |
3 Stats | duration, tokens, cost, context, tool mix, models and a per-prompt breakdown |
4 Files | every file read or changed, with diffs. See Files and diffs |
In the Tools tab, space expands a group and enter on a call shows it in the timeline.