Cost and context
In snoop, you can see what each prompt cost, how full the context window is and where a turn’s time went.
Cost per prompt
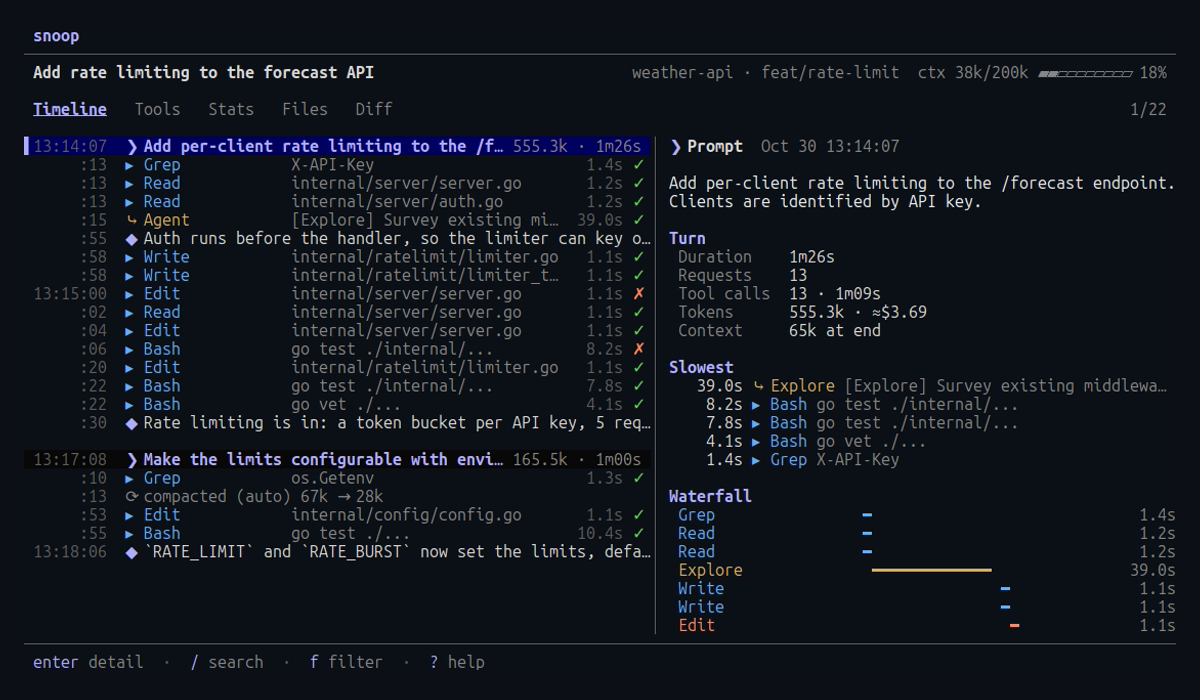
Each prompt row in the timeline shows that turn’s tokens, its estimated cost (marked ≈) and its duration.
The Stats tab totals them for the session and breaks them down by prompt.
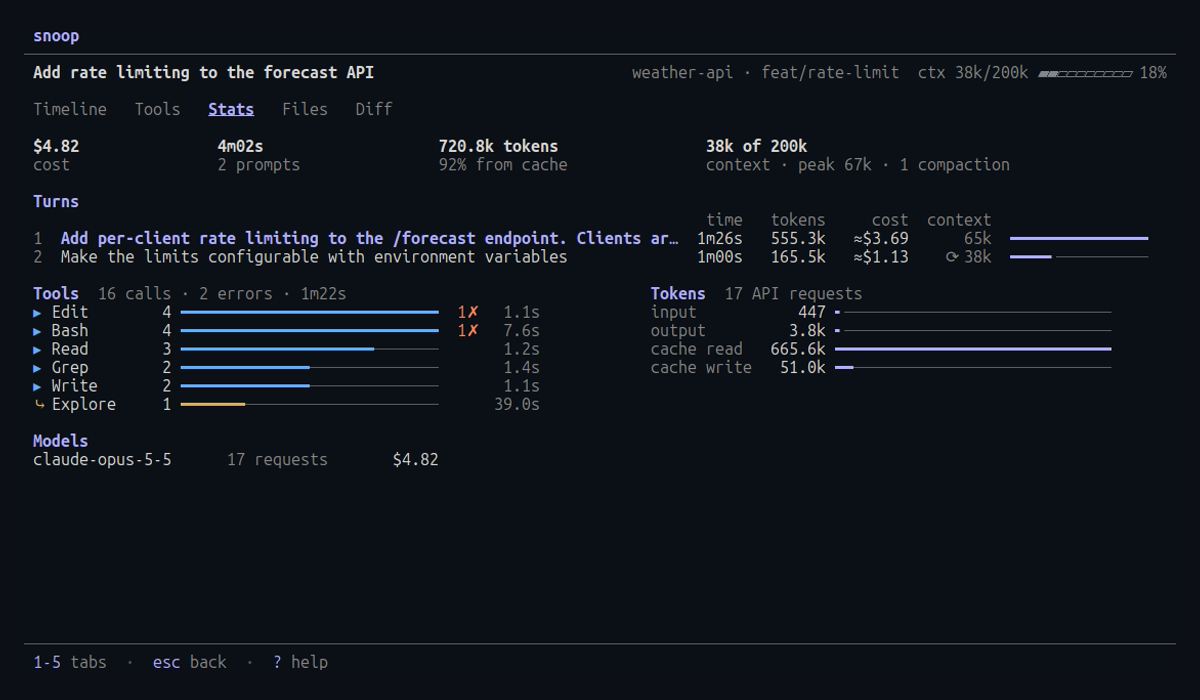
Claude Code records a session’s cost only when the session ends.
While a session runs, snoop estimates its cost from each request’s tokens at the model’s API prices, and marks it ≈ and “estimated”.
The estimate leaves out requests made by subagents, so it can be lower than the cost Claude Code records at the end.
Once the cost is recorded, it replaces the estimate. Claude Code records only each model’s total, so snoop splits that across prompts by their token use, weighted by each kind of token’s price, and the prompt costs add up to the recorded total. Models without a known price show tokens only.
Context
The header shows how full the context window is:
ctx 142k/200k ▰▰▰▰▰▰▰▱▱▱ 71%The meter turns to the accent color at 70% and red at 90%. The Stats tab shows the current and peak context and the number of compactions, and each compaction appears in the timeline with the context before and after it.
Where the time went
Select a prompt row to see its turn in the detail pane: the totals, the five slowest tool calls, and a waterfall that places each call by its start and end. Calls that ran in parallel overlap.
Across sessions
The summary in the session picker totals cost and tokens across sessions, with a daily cost chart for the last 30 days. See Across sessions.