Triage a namespace
Something is wrong in a namespace and you don’t yet know what.
The kubectl version of this is four commands and a lot of scrolling: get pods, then describe the ones that look off, then logs, then get events.
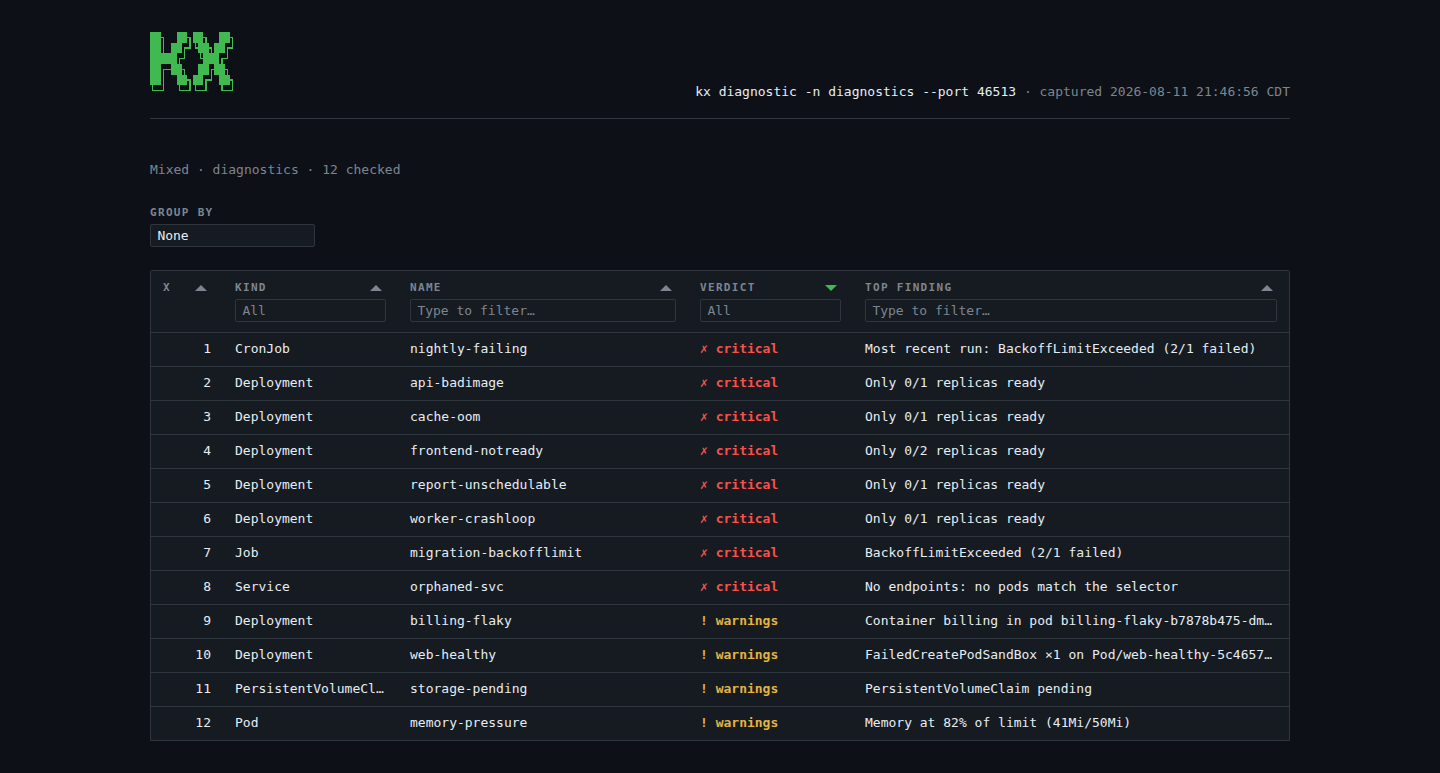
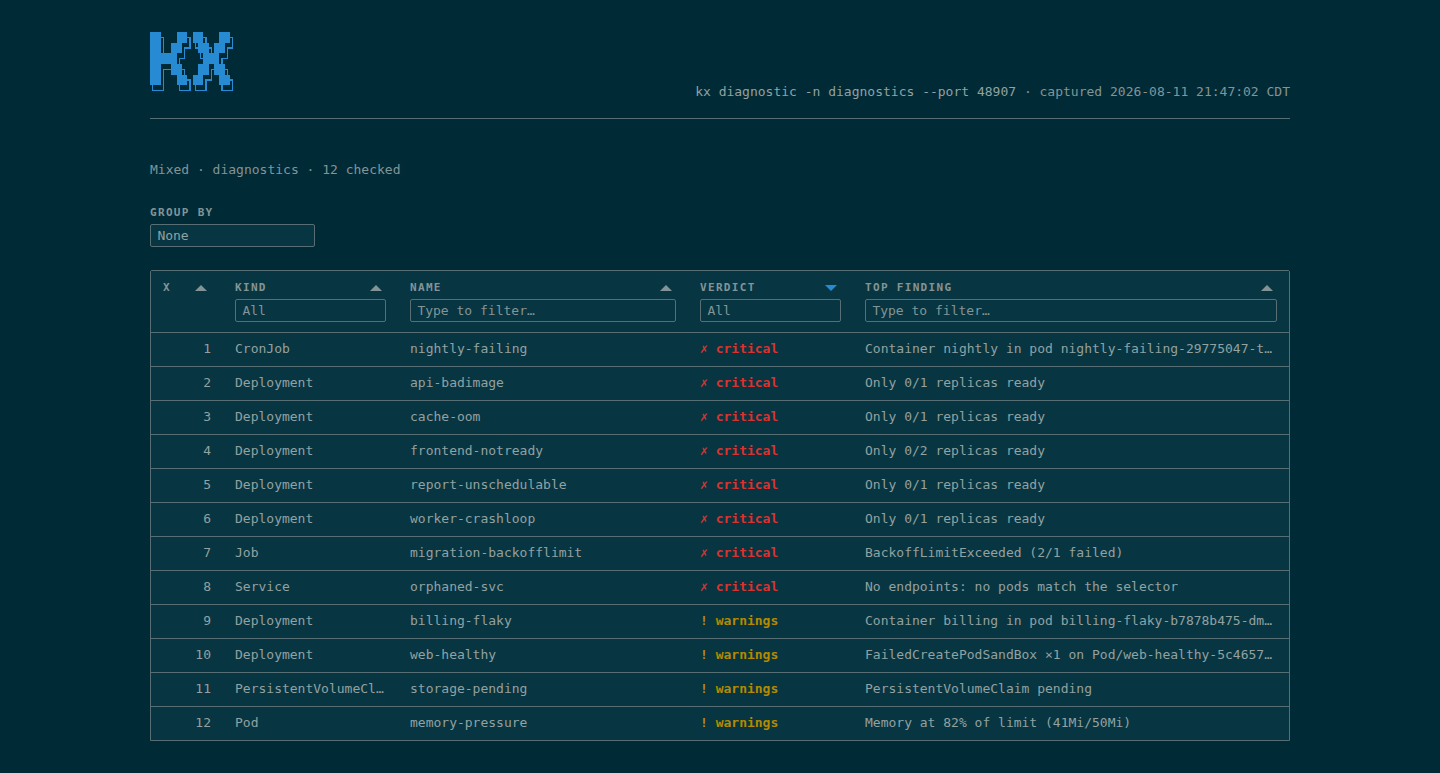
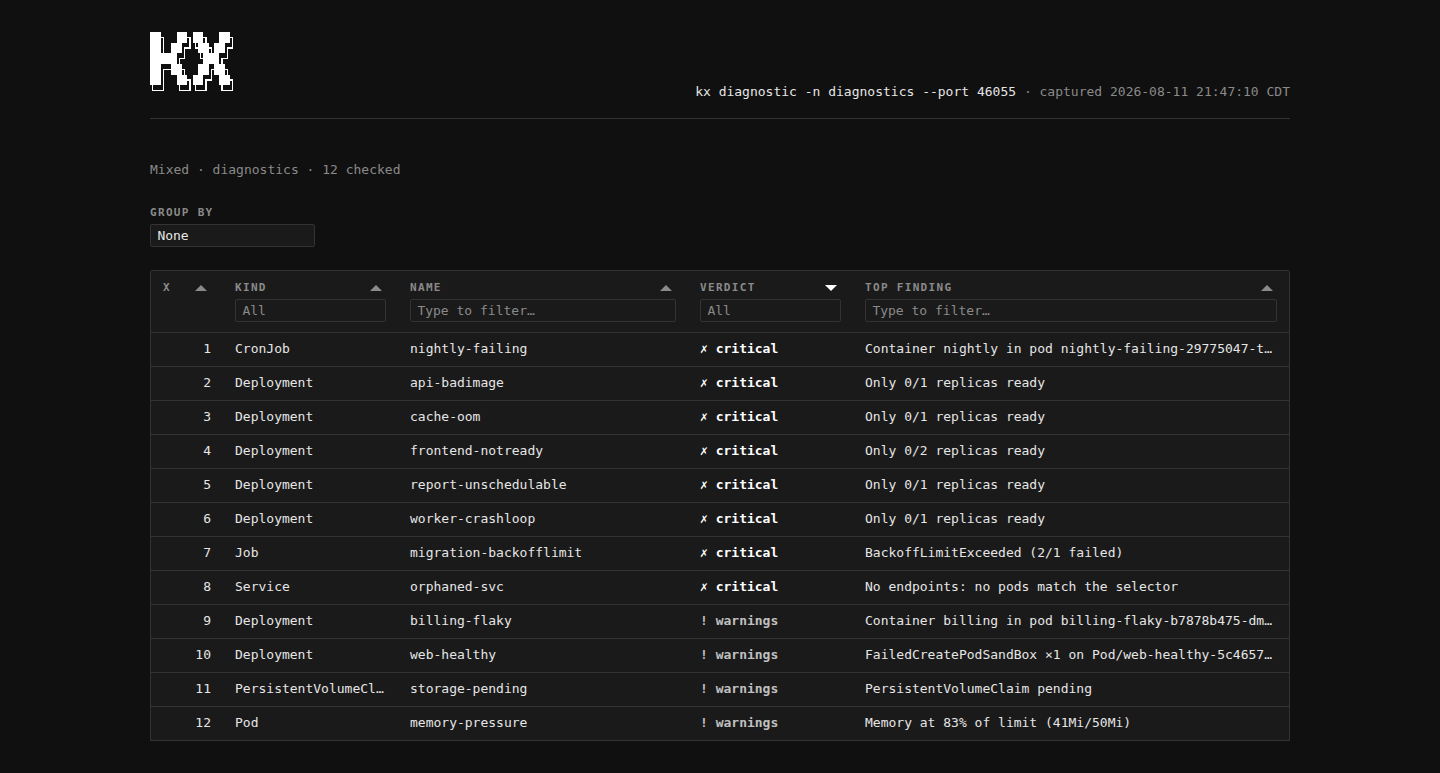
kx diagsweeps the current namespace — Deployments, StatefulSets, DaemonSets, Jobs, CronJobs, Services, PersistentVolumeClaims and Ingresses, plus pods nothing owns — and prints what’s unhealthy, worst first.
Healthy resources are left out of the terminal table.
The --full flag puts them back.
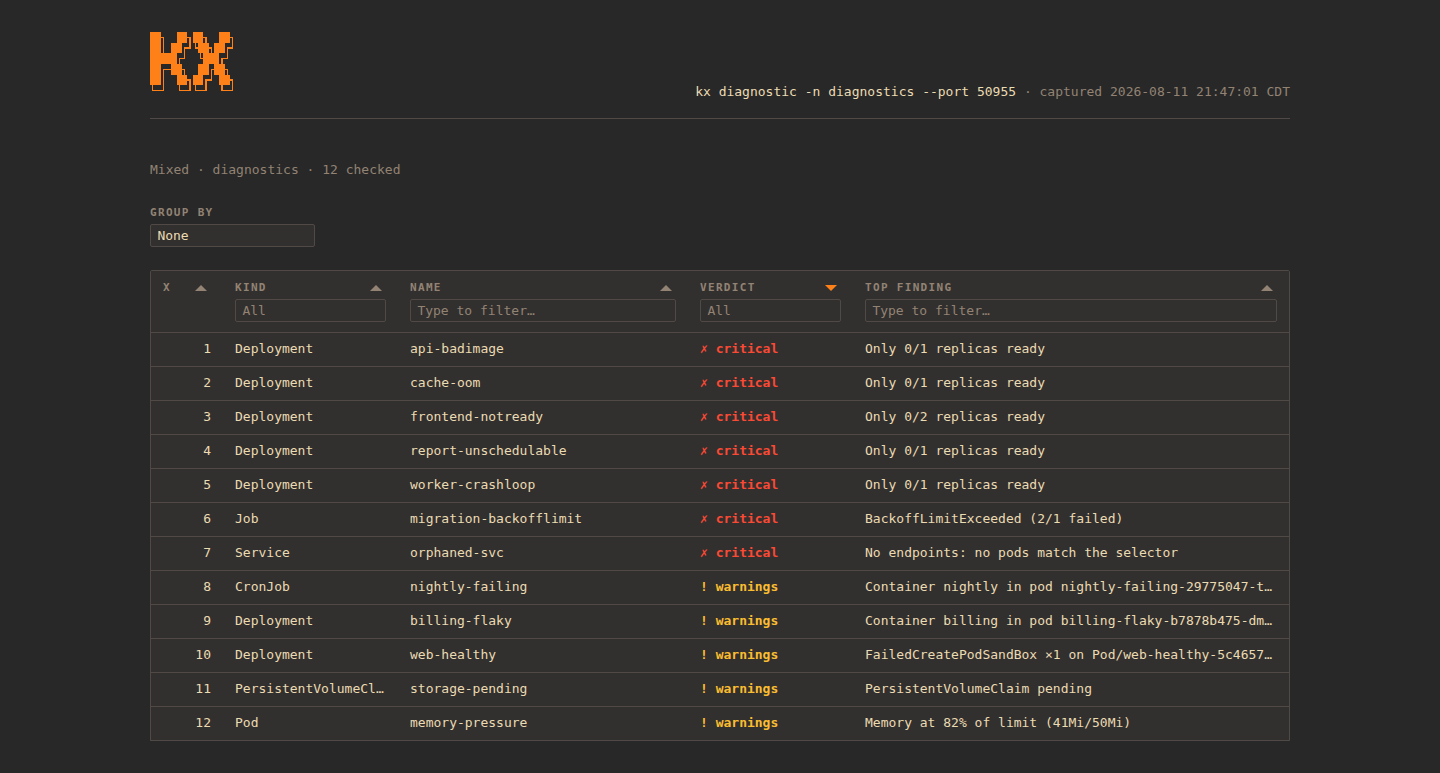
Each row shows one finding, so which of several equally severe findings sorts first decides what the whole sweep reads like. Rows are ordered by severity, and within a severity by how specific the finding is: a concrete cause — a container state, a scheduling refusal, an exceeded limit — outranks a rollup like “Only 0/3 replicas ready”, which outranks a raw warning event. Without that, five differently-broken Deployments all headlined the same replica count and the actual cause sat one screen down.
The rows are indexed
That’s the part that makes it a starting point rather than a report:
kx diag       # 1  api-badimage   ImagePullBackOff
              # 2  cache-oom      CrashLoopBackOff
kx diag 1     # the full diagnosis of row 1
kx logs 2     # straight into the logs of row 2
One resource
With an index, kx diag diagnoses a single resource and prints, on one screen:
- a verdict banner
- a
SUMMARYof findings - a per-pod status table
- recent log tails from broken containers
- warning events
The findings it looks for include CrashLoopBackOff, image pull failures, OOMKills, unschedulable pods, stalled rollouts, Services with no endpoints, Pending PVCs, failed CronJob runs, and Ingresses pointing at Services that don’t exist. Each problem is reported once, on the row it belongs to: a Service’s row is about the Service — its endpoints — while the pods behind it are reported under the workload that owns them.
Now, not once
Everything is reported by default, however old — and --since bounds it to what happened recently: a warning event, a restart or OOMKill a container recovered from, a pod or run that failed.
What is still going wrong is always reported, window or not, however long it has been going wrong: a container in CrashLoopBackOff, a Pending PVC, a Service with no endpoints.
The line is finished versus ongoing, not past versus present.
A container that terminated with an error stopped at a moment and stays stopped, so it is dated and bounded; an ImagePullBackOff from three weeks ago is a pod that has never run, which is a problem now.
Every finding says which it is, and the shape tells you whether a window can reach it:
✗ Image pull failure (ImagePullBackOff) in pod api-badimage-… · for 25d
✗ Only 0/1 replicas ready · for 53d
! Failed ×46241 on Pod/api-badimage-… · 1m ago
A · for 25d is how long something has been true — no --since will hide it.
A · 1m ago is when something happened, and a narrow enough window will.
A pod that flaps counts from its current episode, not its whole history: a crashlooping container is briefly ready on each restart, so · for 46s beside 4675 restarts is the last crash, not the first.
That line matters because a finding drives the verdict and the verdict drives --fail-on.
Without it, one FailedScheduling from three weeks ago holds a healthy workload at warnings forever.
kx diag --since 24h   # today's failures only
kx diag --since 7d    # a week of history
kx diag               # everything, however old
A schedule longer than the window wants --since widened: a weekly CronJob whose last run failed six days ago needs --since 7d to see it.
Set the window once with diag_max_age in config.toml, or KX_DIAG_MAX_AGE in the environment.
Usage as a signal, not just state
Findings also draw on live resource usage, the same data kx top reports.
A pod running hot against its memory limit is flagged as an OOMKill risk before it gets killed, which is the one finding you cannot get from describe.
Nodes
A Node is diagnosed the same way, by index rather than by sweep — it is cluster-scoped, so it appears in neither a namespace sweep nor -A.
kx get nodes
kx diag 1
See taking a node out of service.
Wider than one namespace
kx diag -n prod    # a namespace you aren't in
kx diag -A         # every namespace
kx diag -A -m api  # only what's called api, wherever it is
With -A, the sweep is indexed too, and adds a NAMESPACE column beside the numbers, so kx logs 7 reaches whichever namespace row 7 came from.
The -m flag narrows any sweep by name, the way it narrows kx get: a case-insensitive substring.
Everything the sweep produces covers only what matched — the count, the rows and their numbers, --json, --html, and the --fail-on gate.
As a check
kx diag -A --json
kx diag -A --fail-on critical
The --json flag prints the same sweep as a document, and --fail-on exits 2 when any resource reaches that verdict.
See using kx in CI.
In a browser
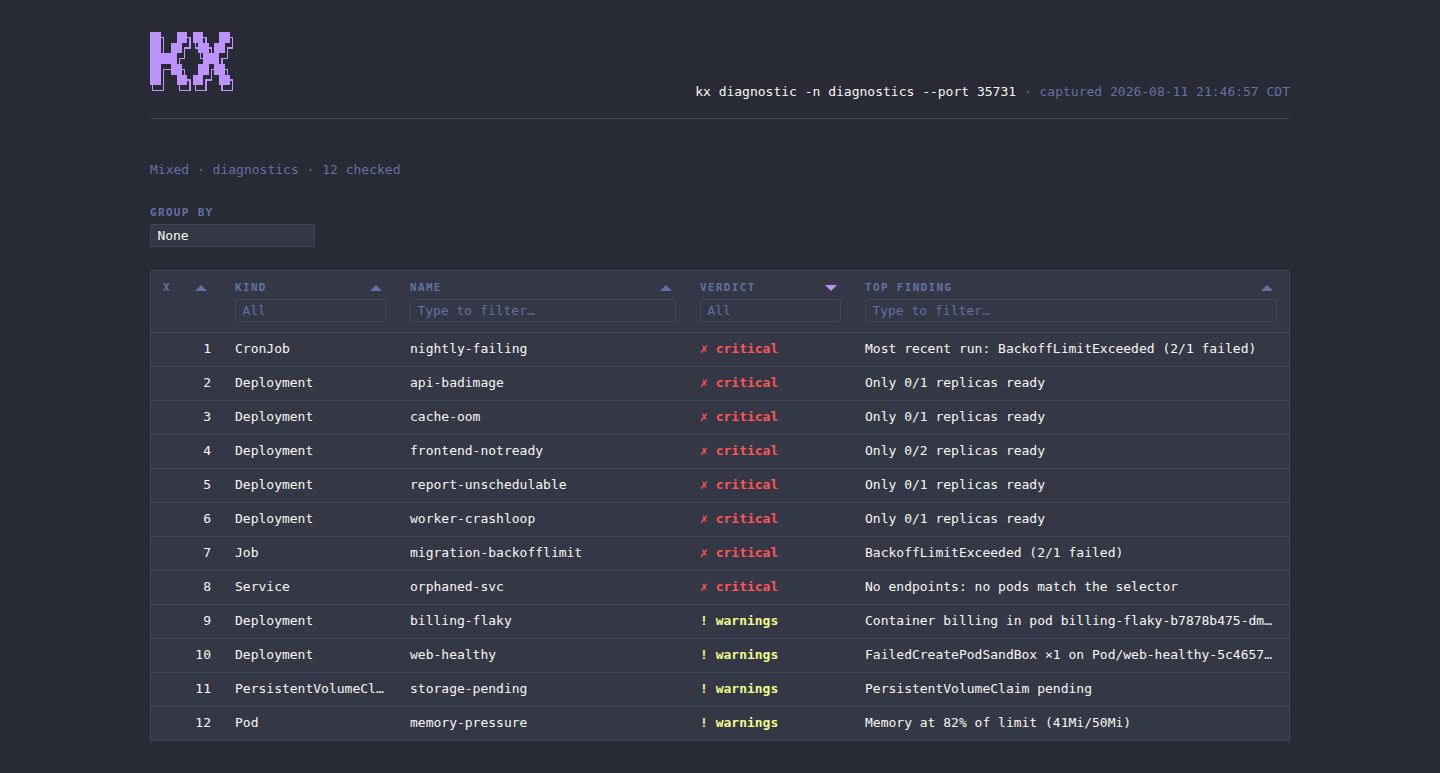
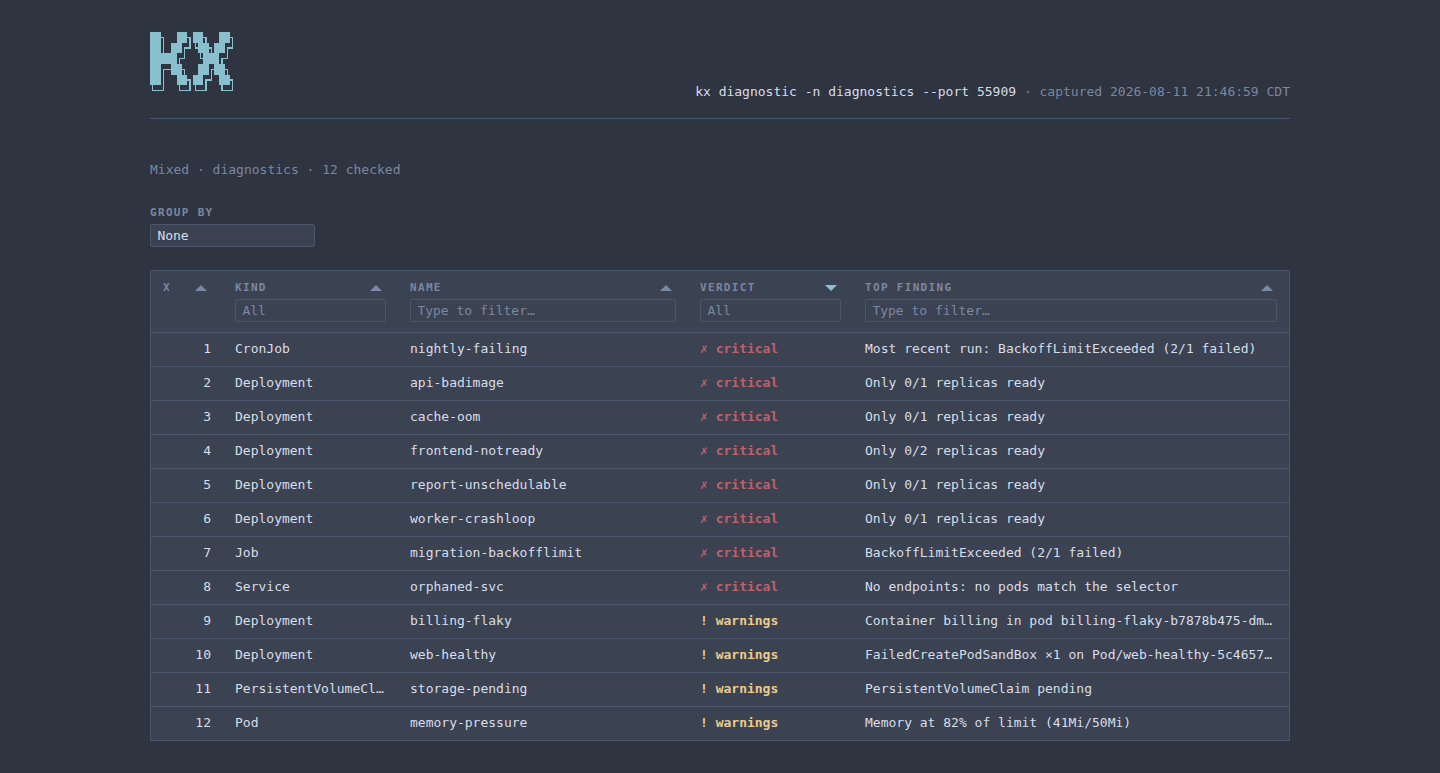
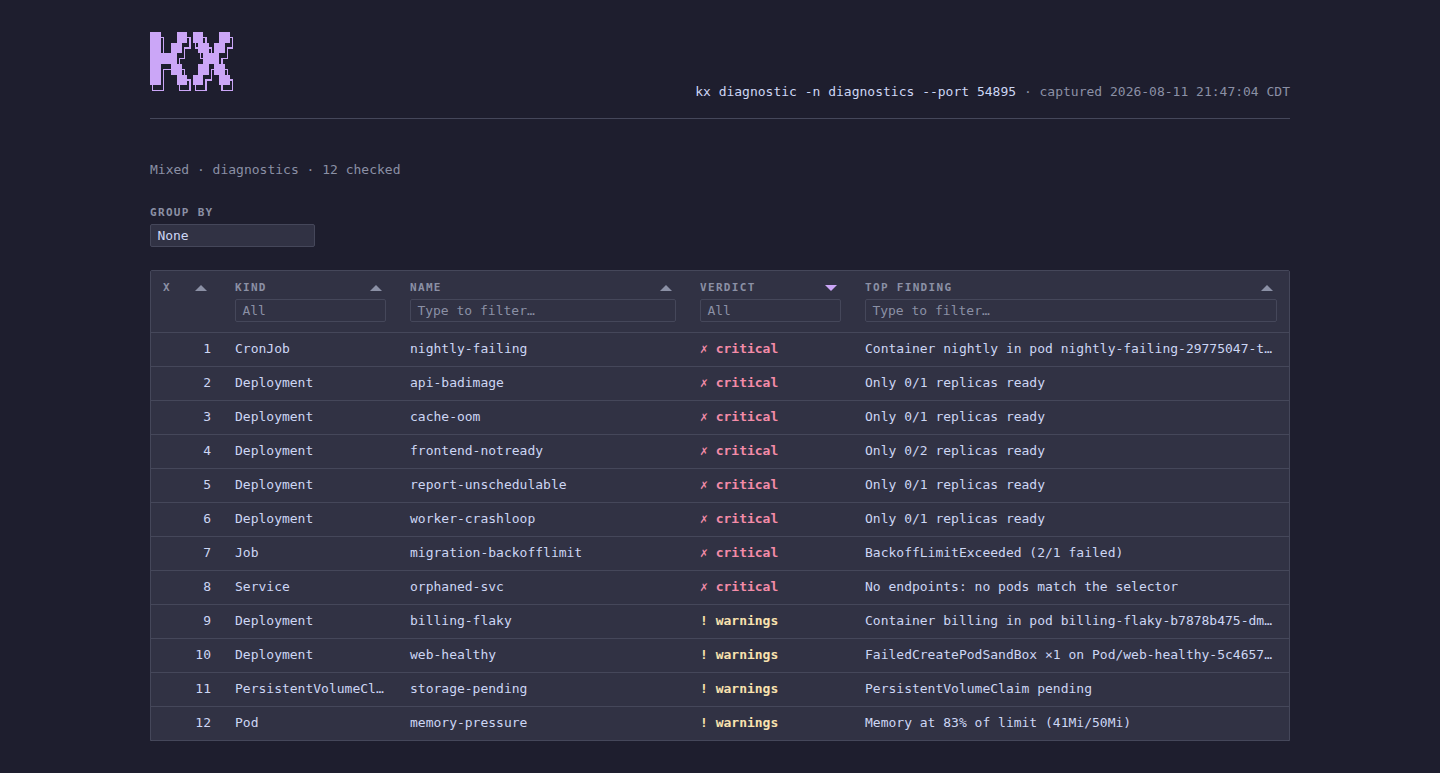
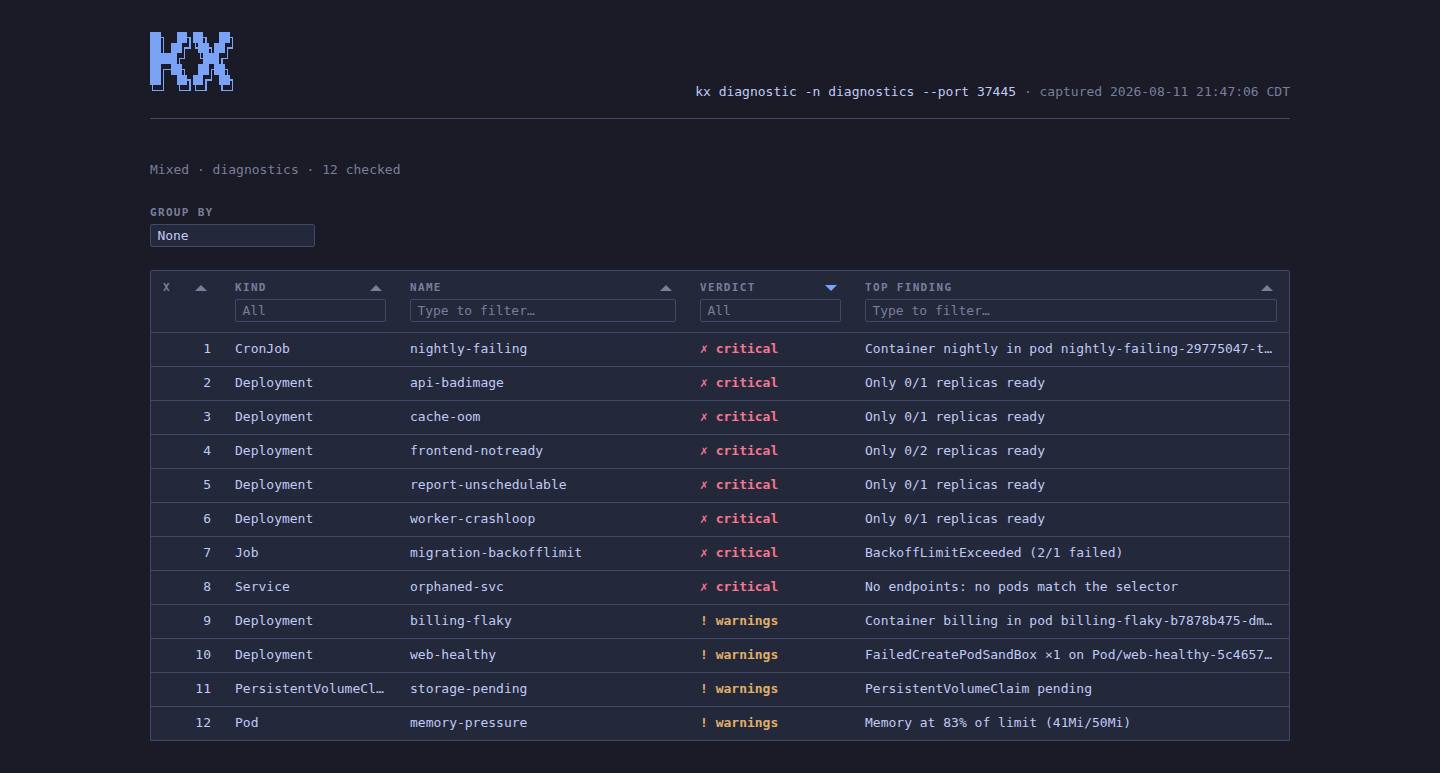
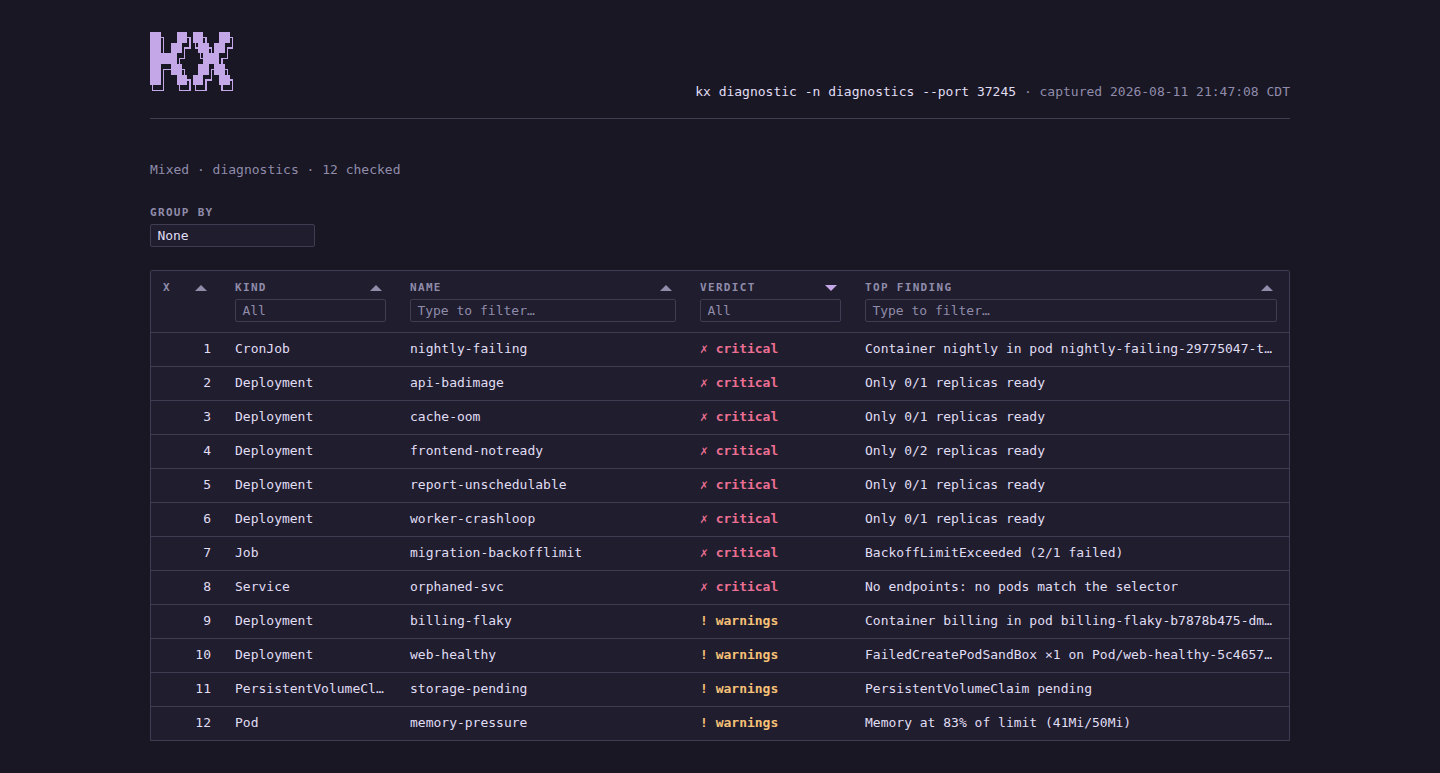
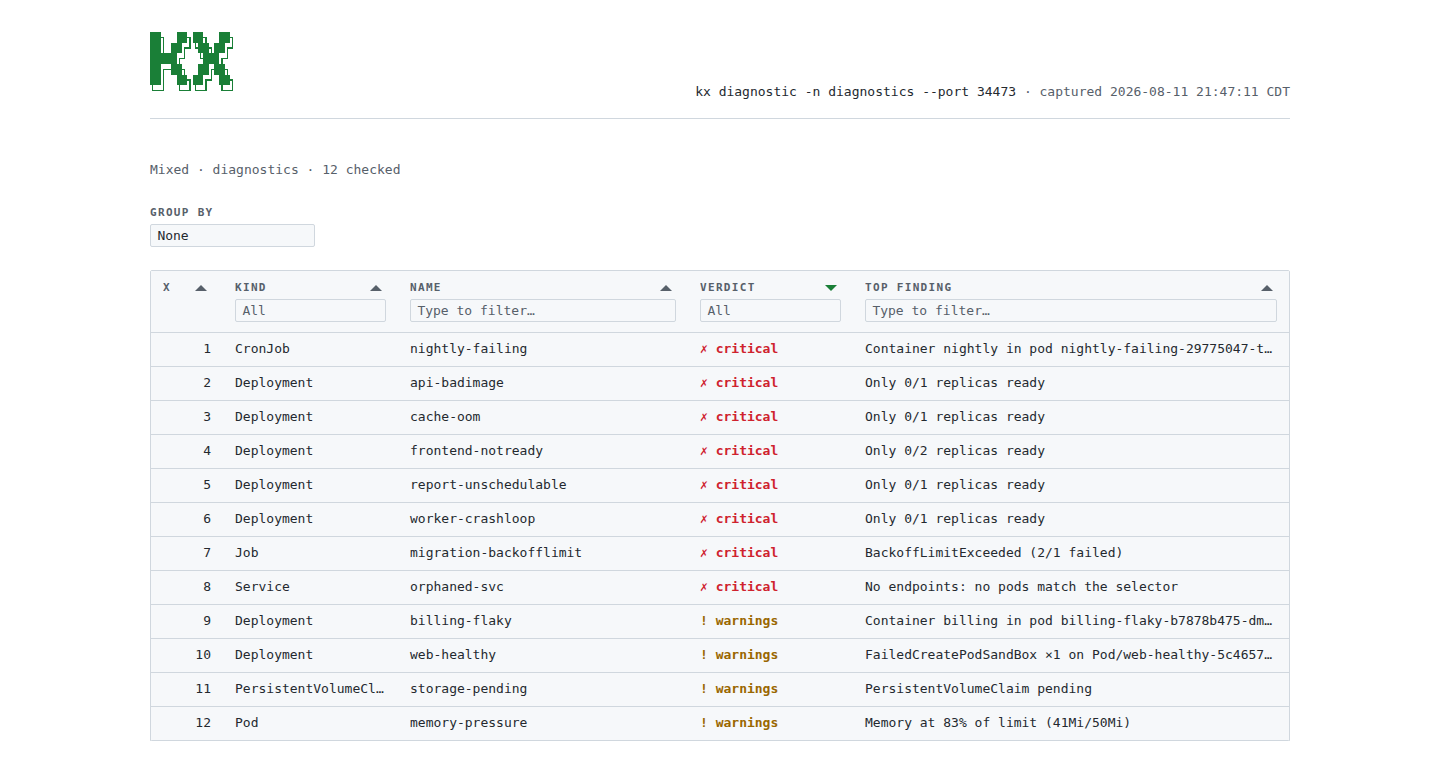
kx diag --htmlrenders the same sweep as a filterable, sortable page and opens it — with a group-by for larger sweeps, and each row expanding into that resource’s full report. See browser reports.