Reports in the browser
Four commands take --html:
kx diag --html
kx scan --html
kx tree --html
kx top  --html
Each renders the analysis it would have printed as a page and opens it in your browser, as well as printing to the terminal. Ctrl-C stops the server.
What it costs
Nothing extra.
The data was already gathered to build the table you’d see without --html — no additional API calls, no second scanner run.
Where it lives
The server binds 127.0.0.1 only, and nothing is written to disk.
The report exists in memory for as long as the command runs, and is gone when you stop it.
kx diag --html --port 8080   # a specific port instead of a free one
kx diag --html --no-open     # don't launch a browser; the URL still prints
Both only mean anything alongside --html — they configure the server it starts — so kx refuses either on its own rather than ignoring it.
kx diag --out diag.html # write the page instead of serving itThe --out flag already says “HTML” in its own name, so it implies --html on its own — kx diag --html --out diag.html still works, but the --html there is redundant.
It replaces the server rather than configuring it: the page is written, the command returns, and no browser opens.
That is what you want in CI, where nothing is there to press Ctrl-C — see Use kx in CI.
Because there is then no server, --port and --no-open are refused alongside it.
The --no-open flag is what you want over SSH with a forwarded port, or in a terminal that would open the wrong browser.
Serving a report and failing on it
The --html flag says where the findings go; it does not say what they mean.
On kx diag and kx scan it composes with --fail-on, so a job can publish a report and still fail the build on what is in it:
kx diag -A --fail-on critical --html --no-openThe exit code lands once the server stops. See using kx in CI.
What the page adds
Detail the terminal has no room for:
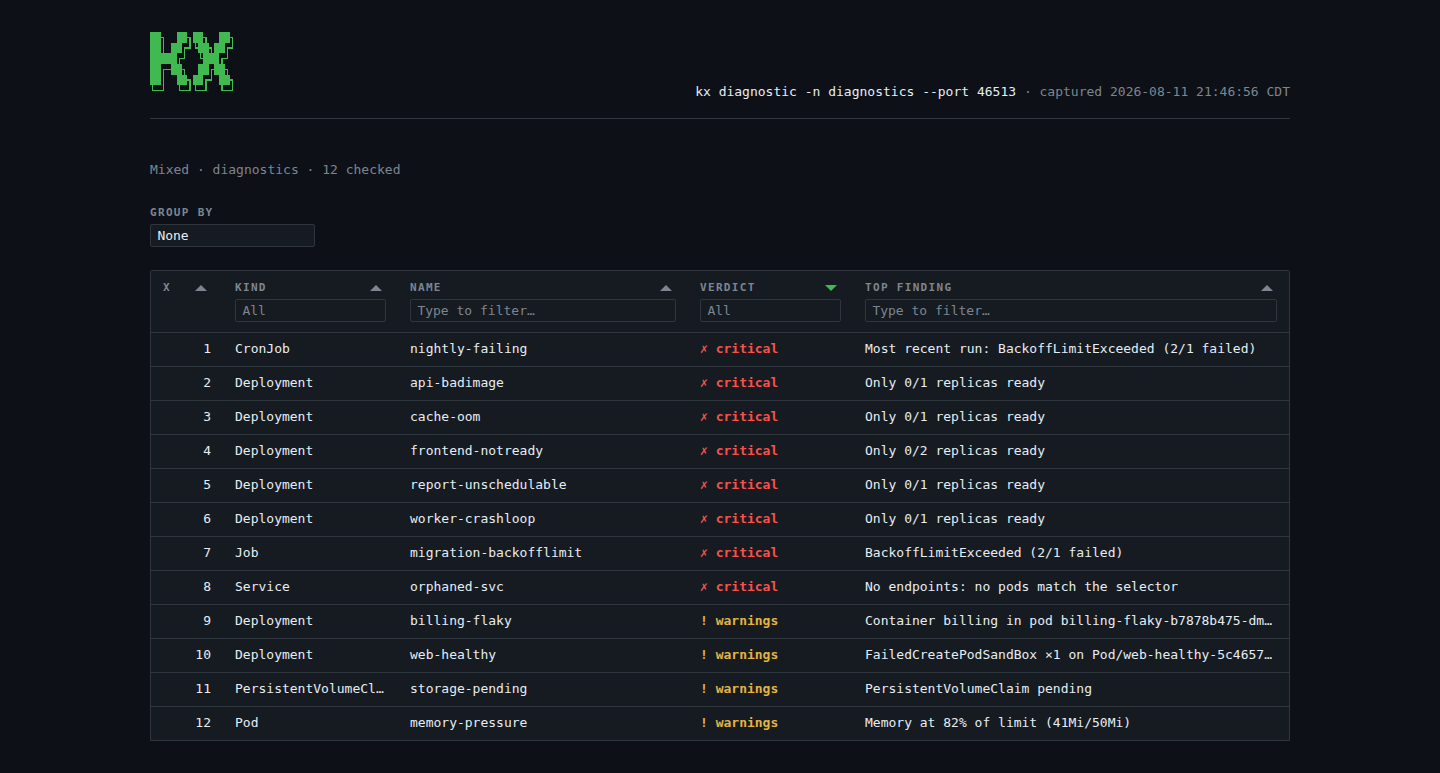
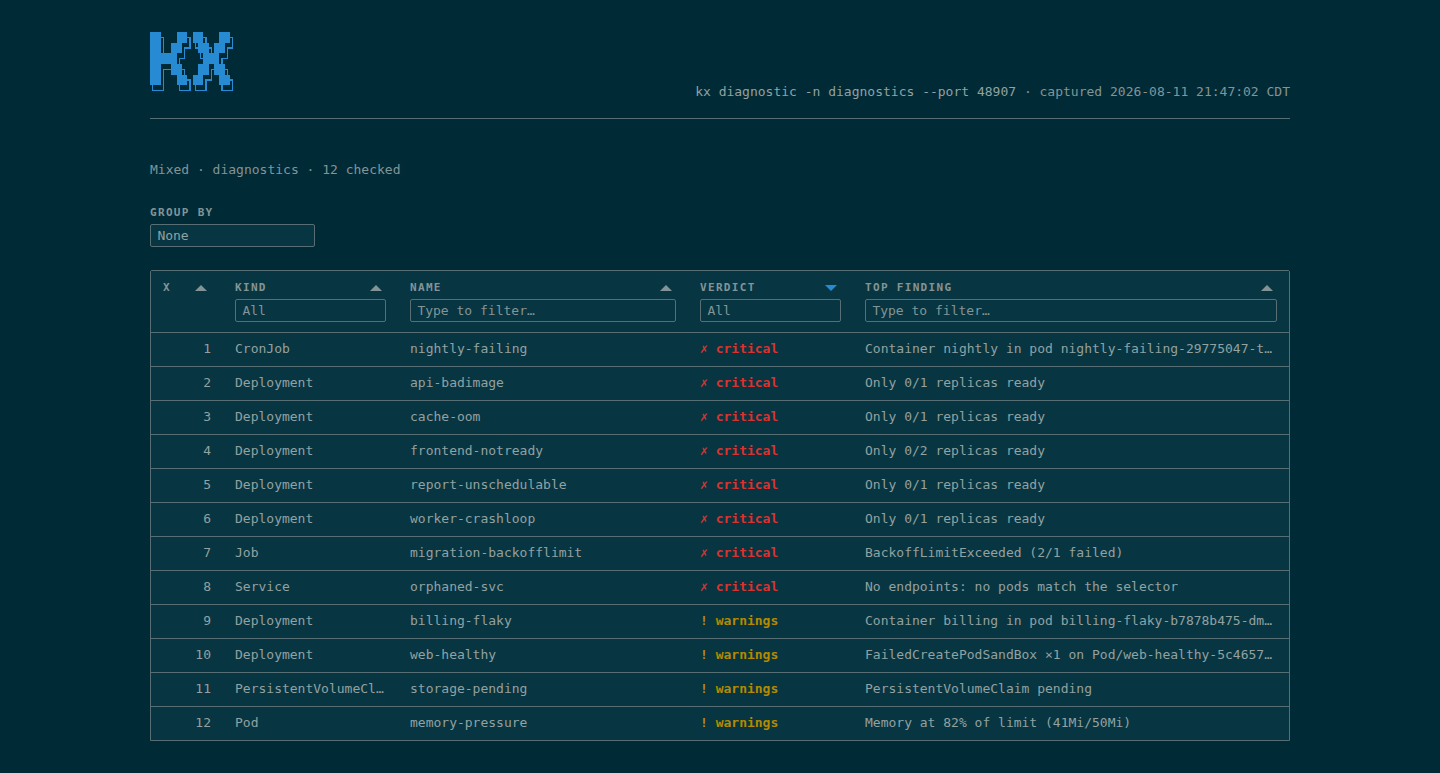
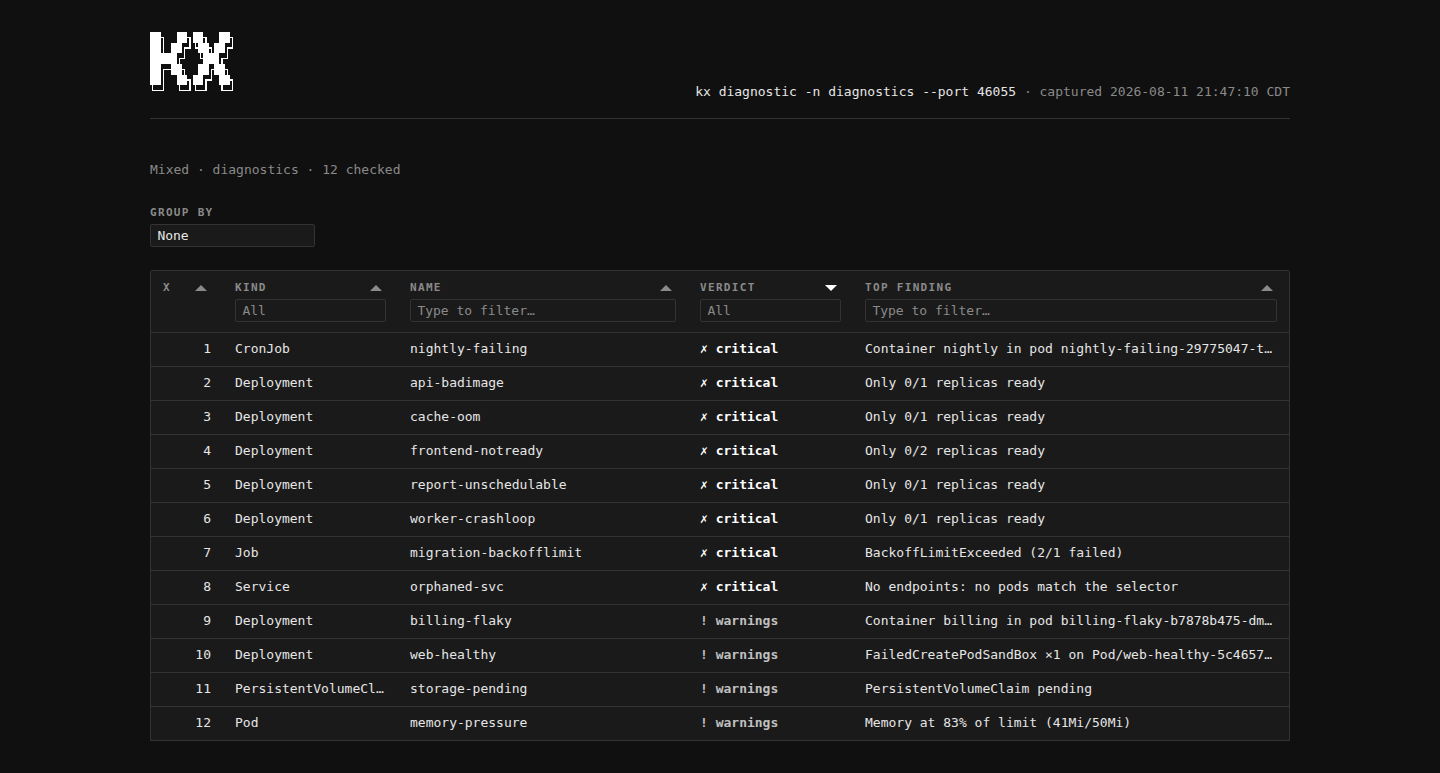
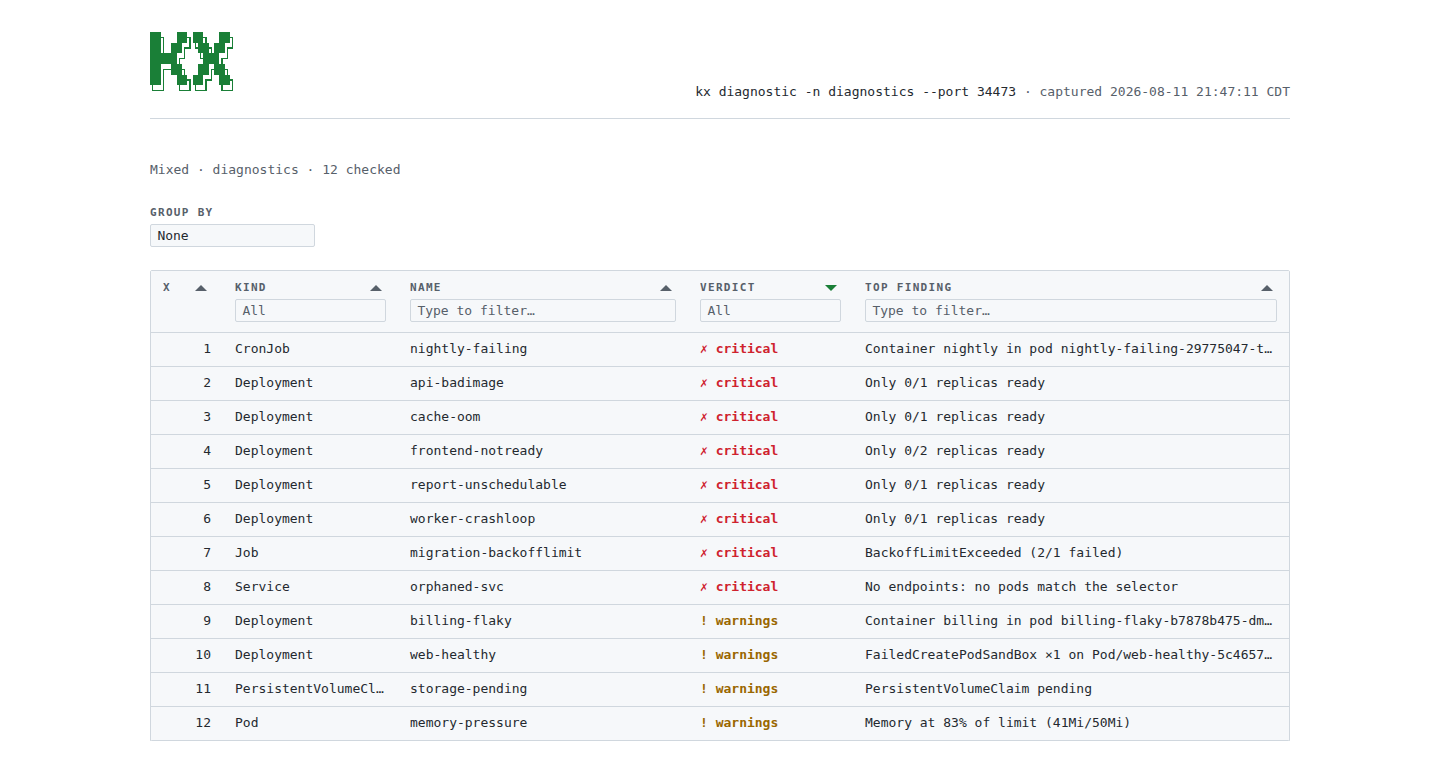
- diag — findings sortable and filterable by any column, with a group-by for larger sweeps; each row expands into that resource’s full report. Unlike the terminal table, the page always includes healthy resources.
- scan — per-image severity counts up top; the CVE table below groups by image and expands each row into the vulnerabilities behind its counts.
- tree — the ownership graph as a collapsible tree.
- top — usage as a percentage of limits, for pods or nodes.
It follows your theme
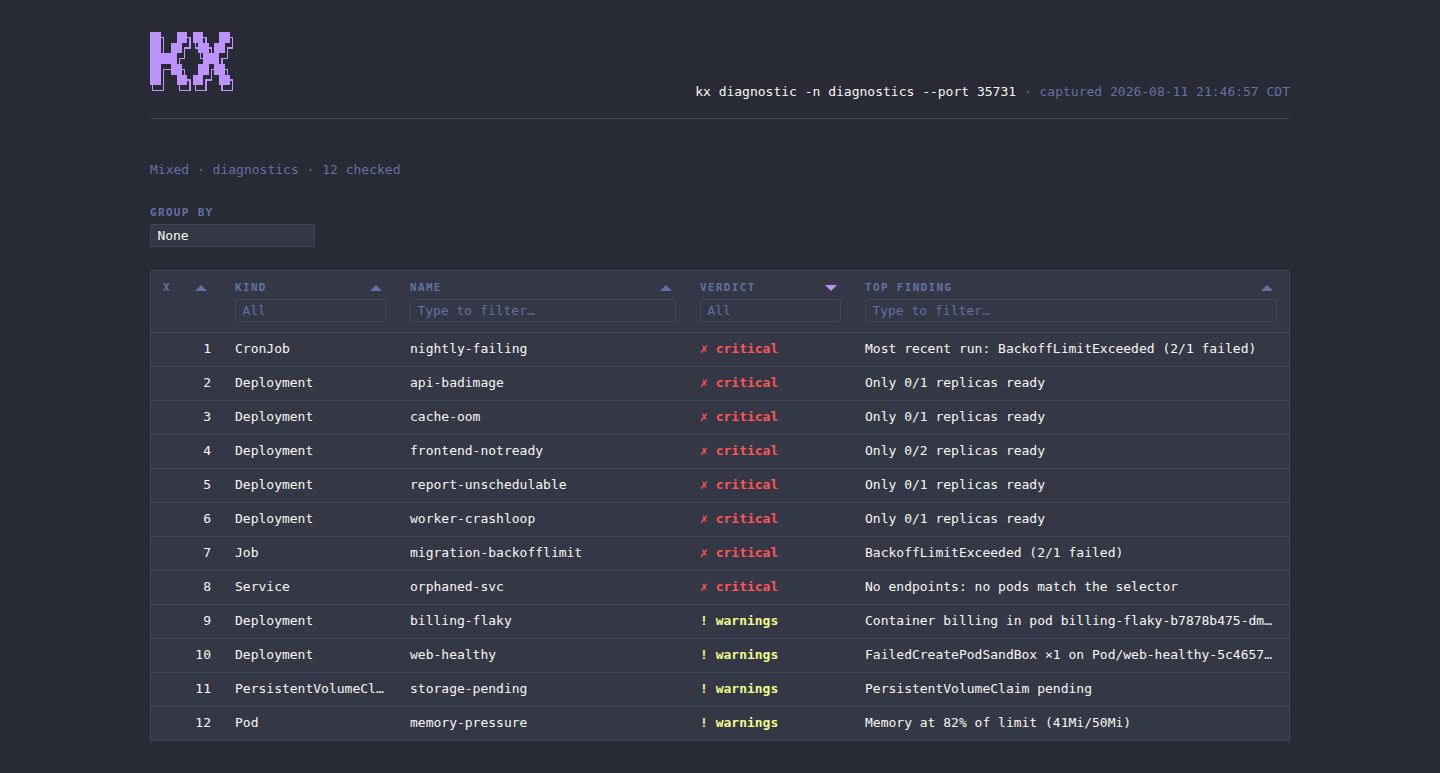
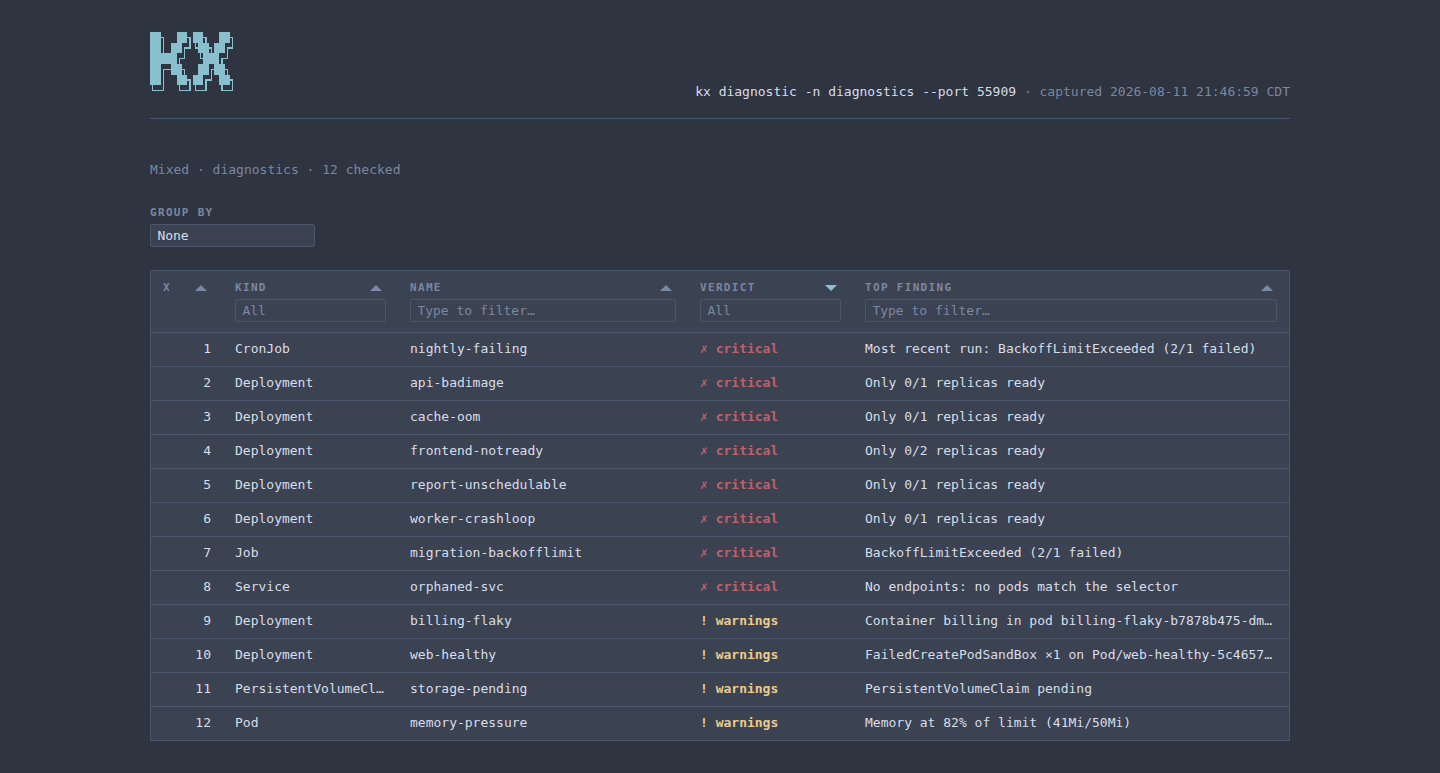
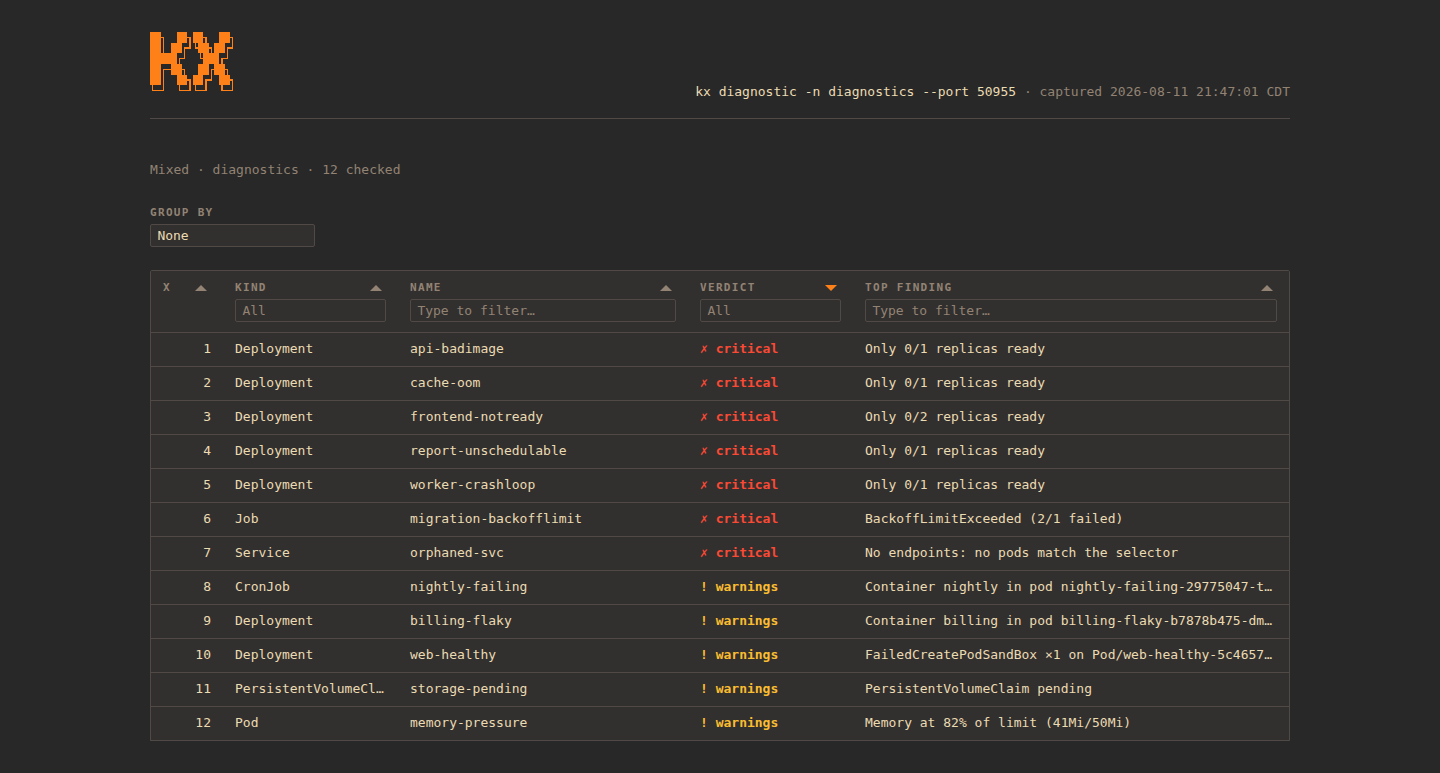
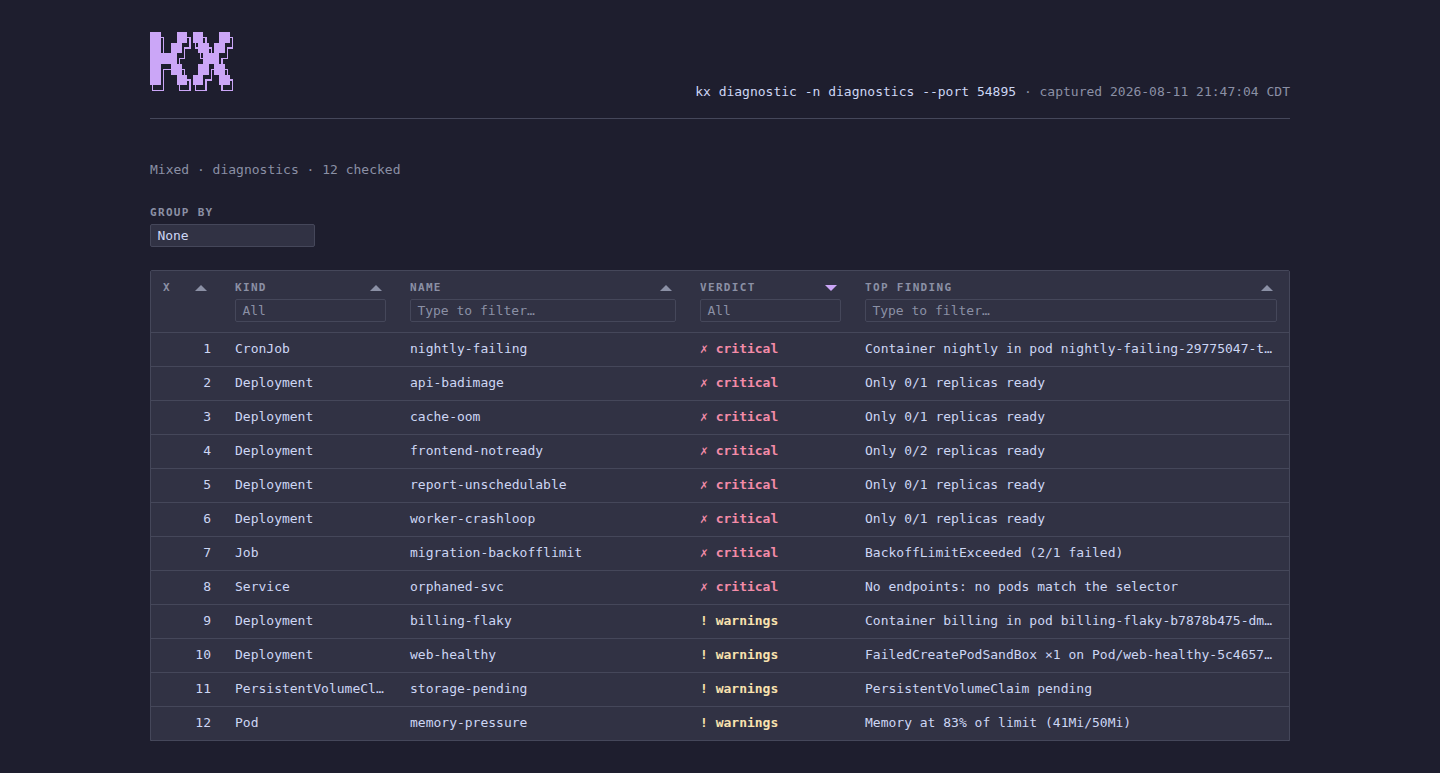
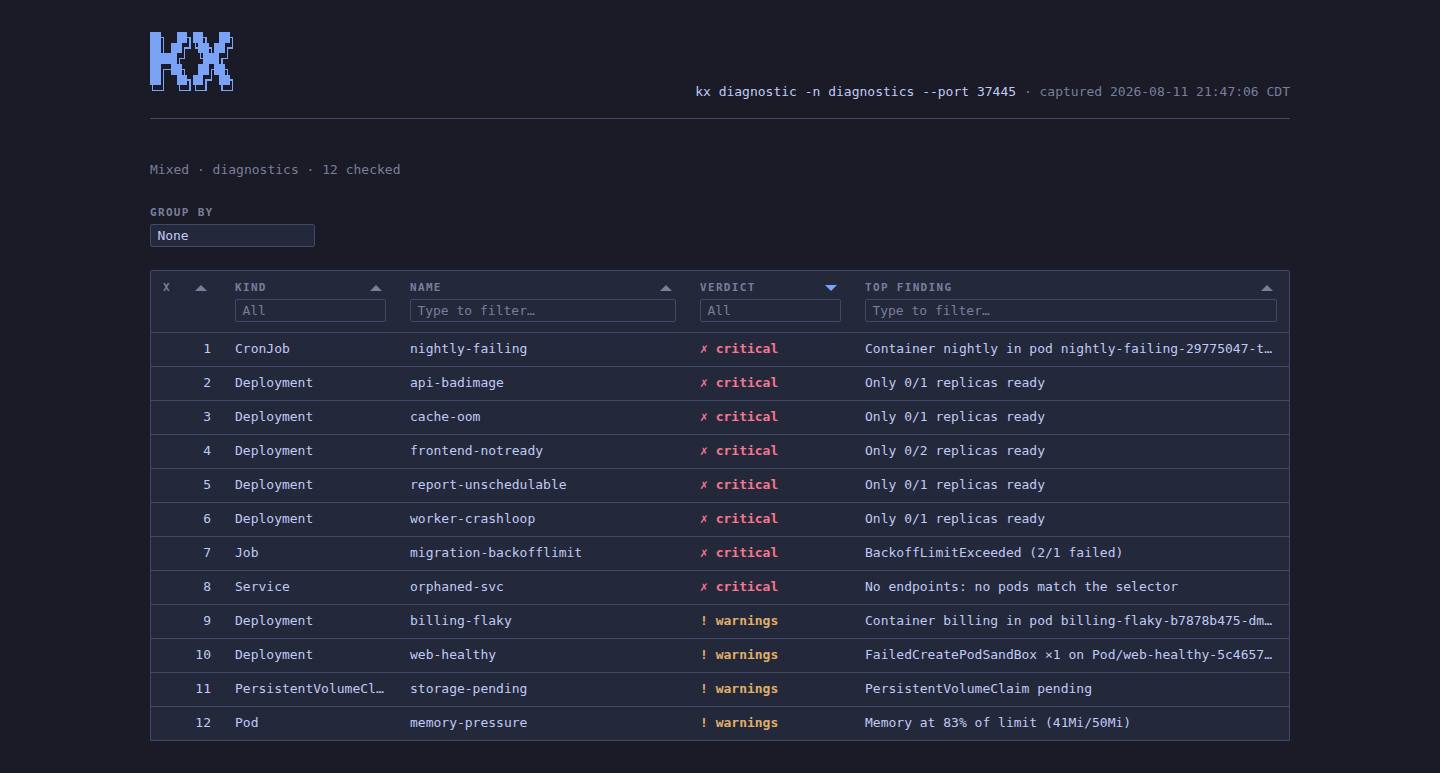
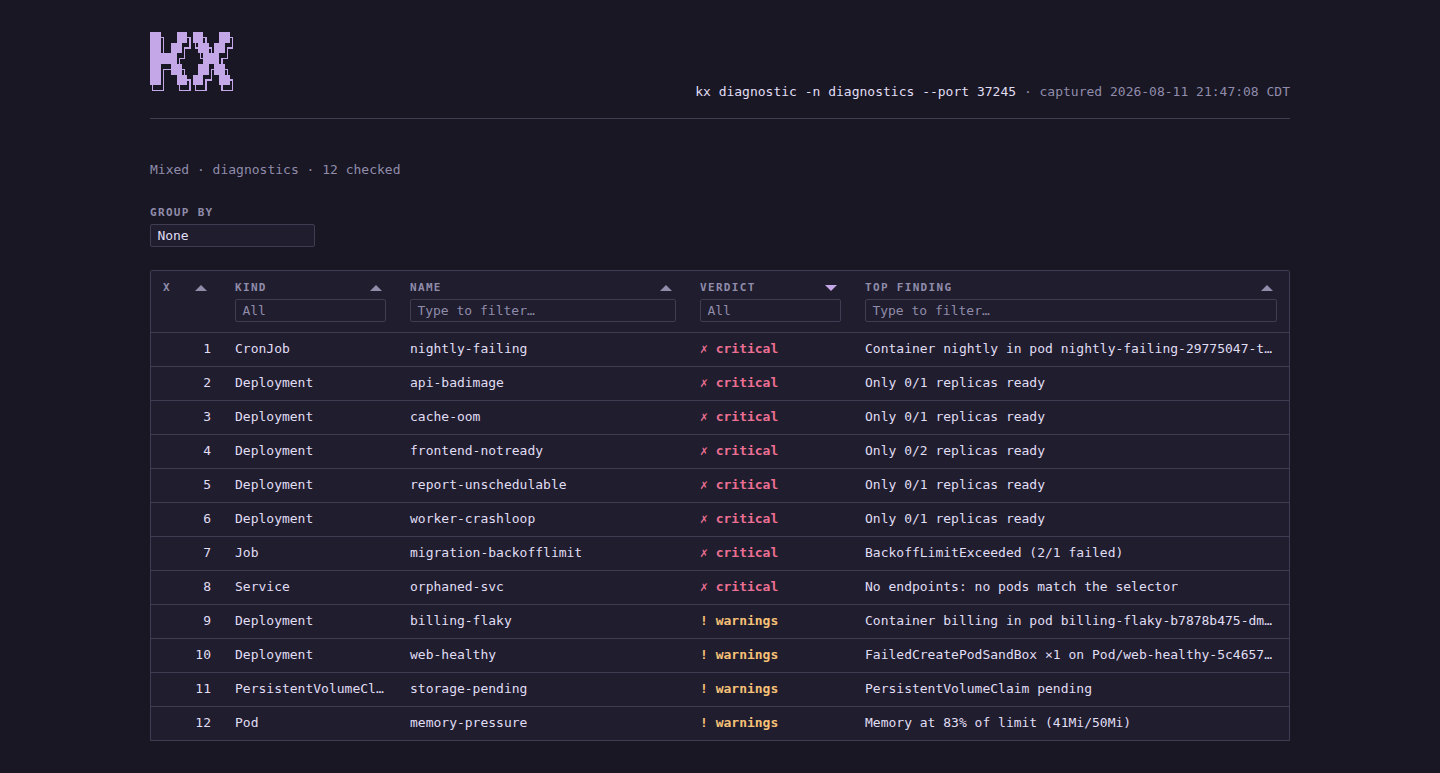
The page is drawn in your active palette, so kx theme dracula restyles the reports along with everything else.
Same registry, same ten palettes — see themes.